<?xml version="1.0" encoding="utf-8"?><feed xmlns="http://www.w3.org/2005/Atom" ><generator uri="https://jekyllrb.com/" version="4.1.1">Jekyll</generator><link href="https://lauster24.de/feed.xml" rel="self" type="application/atom+xml" /><link href="https://lauster24.de/" rel="alternate" type="text/html" /><updated>2023-02-18T08:39:31-06:00</updated><id>https://lauster24.de/feed.xml</id><title type="html">Lauster24</title><subtitle>Personal Blog of Sebastian Lauster for Project documentation
</subtitle><author><name>Sebastian</name></author><entry><title type="html">Free a raspberrypi powermeter [part 1]</title><link href="https://lauster24.de/free-a-raspberrypi-powermeter-part-1.html" rel="alternate" type="text/html" title="Free a raspberrypi powermeter [part 1]" /><published>2023-02-16T00:00:00-06:00</published><updated>2023-02-16T00:00:00-06:00</updated><id>https://lauster24.de/Free%20a%20RaspberryPi%20Powermeter%20%5BPart%201%5D</id><content type="html" xml:base="https://lauster24.de/free-a-raspberrypi-powermeter-part-1.html"><![CDATA[<p>My Powermeter is unfortunately in the Hallway outside my apartment. To get Readouts from the old Ferraris-Meter I found a cheap solution. It’s an “Energiespar Ampel”[EM-Dis-1-TW-BS-R2] from eQ-3 I got for 15€ on ebay. In general, it’s just a Rebranded ELV Homematic HM-ES-TX-WM with an optical Ferraris-Sensor but with a Receiver unit that displays some Power statistics. It is Battery powered and is sending out all the data on 868.3MHz Frequency roughly every 2-3 minutes according to the manual. The current setup is a RaspberryPi 3b with a nanoCUL stick as a receiver and fhem as the interpreter.<br />
The goal was to get rid of this Pi that has also a second use case to communicate with my BLE body scale. The solution to this will be in Part 2.</p>

<h1 id="sdr---softwaredefinedradio">SDR - SoftwareDefinedRadio</h1>
<p>I could have used the nanoCul on my Thinclient and relocate everything on that one, but the nanoCUL seems a bit flimsy.
The Better option I found was an old DVB-T/DAB/FM USB Stick that has a Realtek RTL2832U Chipset. These sticks are commonly used as an SDR Stick for amateur radio operators. It can be used with <a href="https://airspy.com/download/">Airspy SDRSharp</a> Software to look around for interesting signals on the <a href="https://en.wikipedia.org/wiki/Waterfall_plot">Waterfall plot</a>.</p>

<h1 id="rtl_433">RTL_433</h1>
<p>
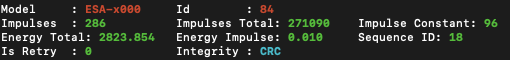
Decoding the signals is quite easy with a Project called <a href="https://github.com/merbanan/rtl_433">rtl_433</a> that, despite its name, is also capable to decode different frequencies besides from 433MHz. For testing, I first plugged it into my Mac Mini and used Homebrew to “brew install rtl_433”. After fiddling around with the command line settings, I settled on “rtl_433 -f 868.3M -R 117” which will start listening on 868.3MHz for Protocol 117 that is looking for ESA1000 / ESA2000 Energy Monitor signals. And soon I got my first result from my Powermeter:
<img src="/assets/img/Posts/Powermeter/CMDResultPowermonitor.png" alt="image" /></p>

<h1 id="final-setup-with-docker">Final Setup with Docker</h1>
<p>I very much love Docker and fortunately there is also a <a href="https://github.com/hertzg/rtl_433_docker">Docker Container for rtl_433</a>.
This Container will run on my Thinclient that handles every hosted service on my Network.
With lsusb I found out that the RTL2838 DVB-T Stick is Plugged in BUS001 as Device 005 with the ID 0bda:2838.
The ThinClient is completely setup and maintained by my Ansible Playbook, where I also added the rtl_433 container with the settings for the MQTT Broker.</p>

<div class="language-plaintext highlighter-rouge"><div class="highlight"><pre class="highlight"><code>- name: Rtl_433
    community.docker.docker_container:
    name: rtl_433
    state: started
    image: hertzg/rtl_433
    pull: true
    restart_policy: unless-stopped
    command: -f 868.3M -R 117 -F "mqtt://MQTTIP:1883,retain=0,devices=rtl_433[/id]"
    devices:
        - "/dev/bus/usb/001/005"
</code></pre></div></div>

<p>Right after the Container was set up, I got the first MQTT messages.</p>

<p>Unfortunately, in the dataset is no information about how much actual W were used in the last period. This needs to be calculated and was calculated before by fhem. It is quite easy in theory, but it took me a while to implement it in OpenHab.
To calculate the Power we need to divide the used kWh between the last two messages, divide it by the time difference between the messages. This Value is then multiplied by 3600s to get kW. [kWhDiff/timeDiff*3600]</p>

<p>Getting this to work in Openhab took a while, but after a bit of googling and some trial and error, I got it working:</p>

<div class="language-plaintext highlighter-rouge"><div class="highlight"><pre class="highlight"><code>    rule "Calculate Watt"
    when
        Item Strom_raw_total changed
    then
    //Strom_lastTime.postUpdate(Strom_raw_total.lastUpdate.toInstant().toEpochMilli()) //since the new item was empty from the beginning i manually initialised it once!
        val time_interval = (Strom_raw_total.lastUpdate.toInstant().toEpochMilli() - Strom_lastTime.state as DecimalType) / 1000 // convert time interval to seconds
        Strom_Timediff.postUpdate(time_interval)
        Strom_lastTime.postUpdate(Strom_raw_total.lastUpdate.toInstant().toEpochMilli())                                            //save last timestamp
        val watt_value = (Strom_raw_total.state as DecimalType - Strom_raw_total.previousState(true).state as DecimalType) / time_interval * 3600 // convert kWh/s to kW
        Strom_actual.postUpdate(watt_value)
    end
</code></pre></div></div>

<p>So every time when the total kWh changes, it calculates the time difference and then the actual kW. Saving the last timestamp gave me some errors, with the newly created item being initialized with NULL. To fix that, I had to run the rule manually with The first line of code active to initialize it.</p>

<p>Now everything is running as it was before with the fhem Setup.</p>]]></content><author><name>Sebastian</name></author><summary type="html"><![CDATA[My Powermeter is unfortunately in the Hallway outside my apartment. To get Readouts from the old Ferraris-Meter I found a cheap solution. It’s an “Energiespar Ampel”[EM-Dis-1-TW-BS-R2] from eQ-3 I got for 15€ on ebay. In general, it’s just a Rebranded ELV Homematic HM-ES-TX-WM with an optical Ferraris-Sensor but with a Receiver unit that displays some Power statistics. It is Battery powered and is sending out all the data on 868.3MHz Frequency roughly every 2-3 minutes according to the manual. The current setup is a RaspberryPi 3b with a nanoCUL stick as a receiver and fhem as the interpreter. The goal was to get rid of this Pi that has also a second use case to communicate with my BLE body scale. The solution to this will be in Part 2.]]></summary></entry><entry><title type="html">Jekyll testing</title><link href="https://lauster24.de/jekyll-testing.html" rel="alternate" type="text/html" title="Jekyll testing" /><published>2022-12-29T00:00:00-06:00</published><updated>2022-12-29T00:00:00-06:00</updated><id>https://lauster24.de/Jekyll%20Testing</id><content type="html" xml:base="https://lauster24.de/jekyll-testing.html"><![CDATA[<p>After a long time of silence on this Blog, I wanted to write a post about a different way of 3D printing maps [Comming soon (tm)].<br />
Since I switched from my Hackintosh to a new Mac Mini, I had to reinstall all the necessary tools and stuff to generate the files for this static page. While revisiting the steps to take, I stumbled across a docker container that has everything I needed in a nice and packaged form.
In this post, I will document the process I am using to generate this site.</p>

<h1 id="preparing-everything">Preparing everything</h1>
<p>On my old setup The files have been handled by Gitea already so there was nothing to be changed. VSCode makes it really easy to work with a git Repository.<br />
All my Docker containers nowadays run on a very efficient ThinClient already, which I wanted to use for this.
My plan was to use the <a href="https://hub.docker.com/r/jekyll/jekyll/">Jekyll Docker</a>, and then automatically grab the most recent files from Gitea, to generate a testing and building environment.</p>

<h1 id="script-to-handle-everything">Script to handle everything</h1>
<p>After playing around and getting the Container to generate the website from manually copied files, I started to automate things a bit.
In the end, I came up with a simple way to generate and test everything.<br />
I connect via SSH to my docker host and simply run “bash JekyllBuild.sh start” to bring up the Container, getting the latest files from Gitea, install all the necessary Gems and finally serve the website.
When changing something in the repository, I can run “bash JekyllBuild.sh update” to get the latest state and rebuild the website.<br />
Finally, after making sure everything is fine, I use “bash JekyllBuild.sh build” to stop everything and build all the files to put on HERE to bring them to you.</p>

<p>This has been my first real use case for a Bash Script, and I am quite happy with what it can do.<br />
[Edit] After some feedback I added the -h/help section</p>

<div class="language-plaintext highlighter-rouge"><div class="highlight"><pre class="highlight"><code>#!/bin/sh bash

# stop: stopping the Container Jekyll
# start: start the container for testing
# update: renew the post and image files from gitea
# build: Build the files for the web

if  [ -n "$1" ]
then
    echo Parameter found
else
    printf "\nNo Parameter provided. specify what you want to do. start, stop, update, build\n\n"
    exit
fi

if [ $1 = "stop" ]
then
    echo stop container
    docker container stop Jekyll
fi

if [ $1 = "-h" -o $1 = "help" ]
then
    #Helpinfos
    printf " -----------------------------Help-------------------------------------- \n"
    printf " -h or help\t Shows this help  \n"
    printf " stop \t\t Will stop the Jekyll container  \n"
    printf " start \t\t Will start the Jekyll container for testing. initial renewal from git \n"
    printf " update \t Will renew all the files from git \n"
    printf " build \t\t Builds all the files for the Web version \n"
fi

if [ $1 = "start" ]
then
    rm -r /srv/Docker/Jekyll/Daten/*
    cd Daten
    wget http://192.168.0.153:4000/Sebastian/Jekyll_Blog/archive/master.zip -O master.zip
    unzip -o master.zip
    chown sebastian:sebastian jekyll_blog -R
    echo starting the container with the server. This may take up to 30s!
    docker run -d --rm --name=Jekyll --volume="/srv/Docker/Jekyll/Daten/jekyll_blog:/srv/jekyll:Z" --network=host jekyll/jekyll jekyll serve -P 4040 -H 192.168.0.153
fi

if [ $1 = "update" ]
then
    cd Daten
    rm -r jekyll_blog/_posts/*
    rm -r jekyll_blog/assets/img/Posts/*
    wget http://192.168.0.153:4000/Sebastian/Jekyll_Blog/archive/master.zip -O master.zip
    unzip -o master.zip
    chown sebastian:sebastian jekyll_blog -R   
    echo Updated all the posts. Only the posts with images!
fi

if [ $1 = "build" ]
then
    docker container stop Jekyll
    echo wait 10s to completely stop the container
    sleep 10
    rm -r /srv/Docker/Jekyll/Daten/*
    cd Daten
    wget http://192.168.0.153:4000/Sebastian/Jekyll_Blog/archive/master.zip -O master.zip
    unzip -o master.zip
    chown sebastian:sebastian jekyll_blog -R
    echo starting the build
    docker run --rm --name=Jekyll --volume="/srv/Docker/Jekyll/Daten/jekyll_blog:/srv/jekyll:Z" --network=host jekyll/jekyll jekyll build
    echo Building is finished. you can now move the files of the _site folder to the Webserver
fi
</code></pre></div></div>]]></content><author><name>Sebastian</name></author><summary type="html"><![CDATA[After a long time of silence on this Blog, I wanted to write a post about a different way of 3D printing maps [Comming soon (tm)]. Since I switched from my Hackintosh to a new Mac Mini, I had to reinstall all the necessary tools and stuff to generate the files for this static page. While revisiting the steps to take, I stumbled across a docker container that has everything I needed in a nice and packaged form. In this post, I will document the process I am using to generate this site.]]></summary></entry><entry><title type="html">3d printing a gps track</title><link href="https://lauster24.de/3d-printing-a-gps-track.html" rel="alternate" type="text/html" title="3d printing a gps track" /><published>2021-10-21T00:00:00-05:00</published><updated>2021-10-21T00:00:00-05:00</updated><id>https://lauster24.de/3d%20Printing%20a%20GPS%20Track</id><content type="html" xml:base="https://lauster24.de/3d-printing-a-gps-track.html"><![CDATA[<p>I was on a roadtrip through Norway this summer with a friend, and we did a couple of hikes. About a year ago I tried 3Dprint the GPS tracks with a tutorial from <a href="https://www.instructables.com/Make-a-3d-Print-of-Your-Hike-From-a-GPS-Track/">Instructables</a> which was kinda successful but complicated. I never used Blender before, so it was totally new to me. Unfortunately, Blender changed a couple of things in their UI and functions which made it a bit hard to follow. In the following, I will document my steps with the current Blender Version (2.93.5 for Mac) and Meshmixer.</p>

<h2 id="blender-setup">Blender Setup</h2>
<p>You need to install the <a href="https://gumroad.com/l/blender-osm">OSM Plugin</a>. The free version is enough. In the Plugin settings, you need to specify a Terrain file directory. This is just for saving the downloaded OSM data. You also need to activate the “Mesh: 3D-Print Toolbox”. Create a new “General” project and throw away the standard cube, light and camera.</p>

<h2 id="importing-the-terrain-and-track">Importing the Terrain and Track</h2>
<p><img src="/assets/img/Posts/Blender/10OSM.png" alt="image" />
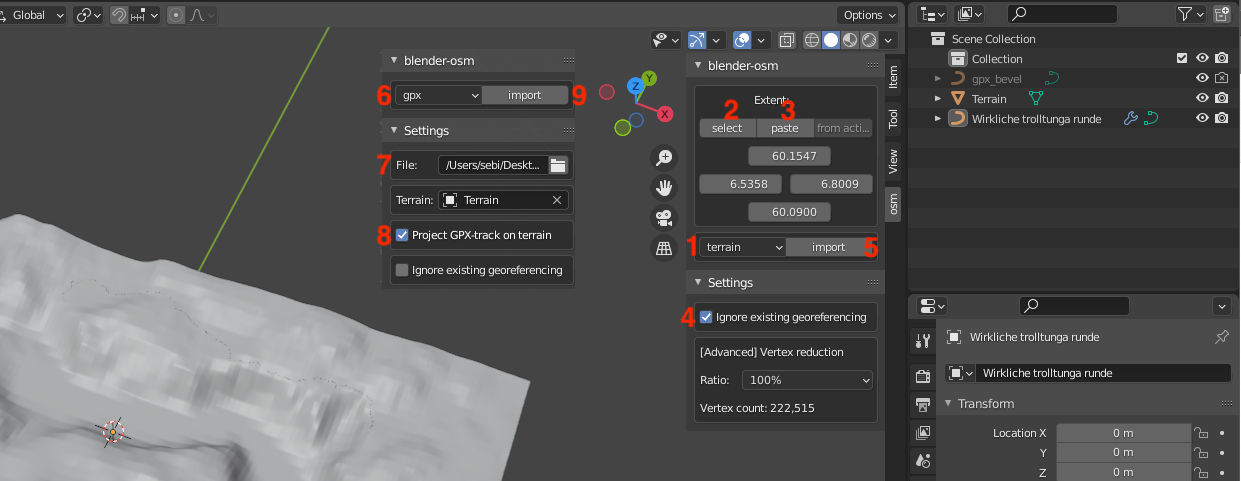
To find the OSM Plugin in the UI, there is a small arrow which hides the menu. In the “OSM” Tab choose terrain[1] in the Dropdown and then hit the select[2] button which will open a Browser window to select the area of the map that your track is in. Choose it bigger than your actual track. Then paste[3] it into the UI and tick the box “ignore existing georeferencing”[4]. After that, you can hit import[5]. Depending on the size, you might not be able to see it, because it’s bigger than the workspace. We will shrink it later.
Now choose GPX[6] in the dropdown and navigate to your GPX track[7]. Tick the box “project GPX-Track on terrain”[8] but do not “Ignore existing georeferencing”! Now, you can also hit import[9].</p>

<h2 id="scaling-down-and-make-it-workable">Scaling down and make it workable</h2>
<p><img src="/assets/img/Posts/Blender/20Scaling.png" alt="image" />
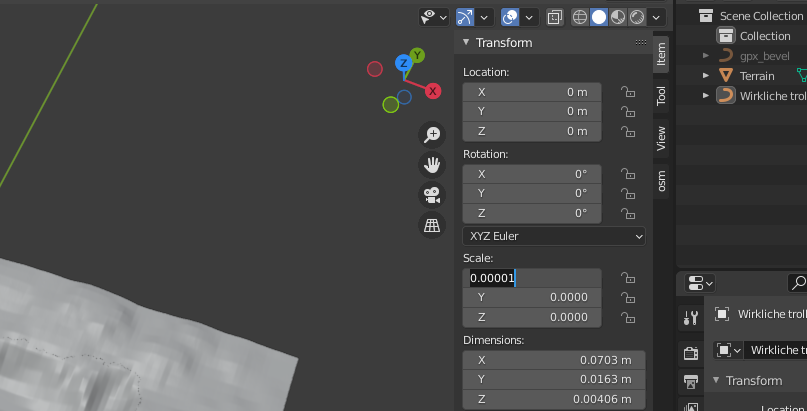
To make it smaller, choose the terrain, and start to reduce the size with the scale in the “Item” menu. A good starting point is 0.005, but depending on the size it may be much smaller until it’s almost fitting your printer. If you want, you can exaggerate the height to make it more extreme. It is important to scale X and Y direction the same to keep everything in place. Note your scaling factor somewhere and apply it also to the track.</p>

<h2 id="choosing-the-final-area--30setcube">Choosing the final Area  30SetCube</h2>

<p><img src="/assets/img/Posts/Blender/30SetCube.png" alt="image" />
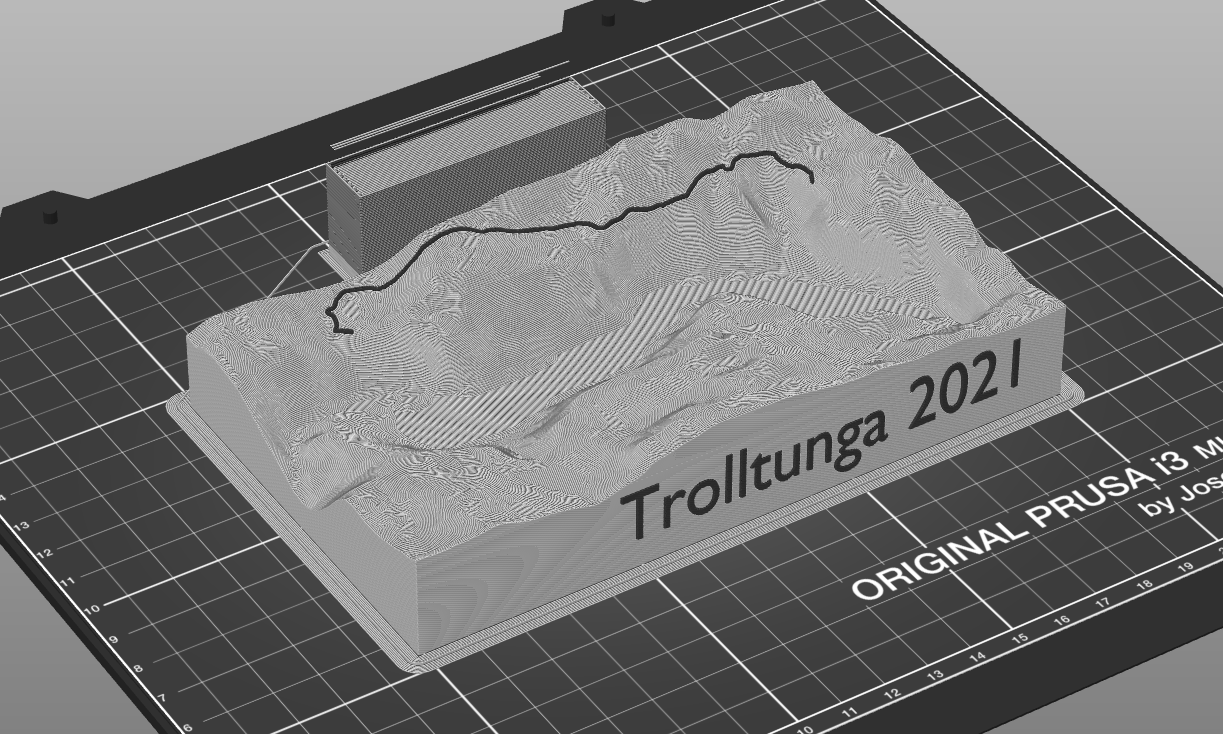
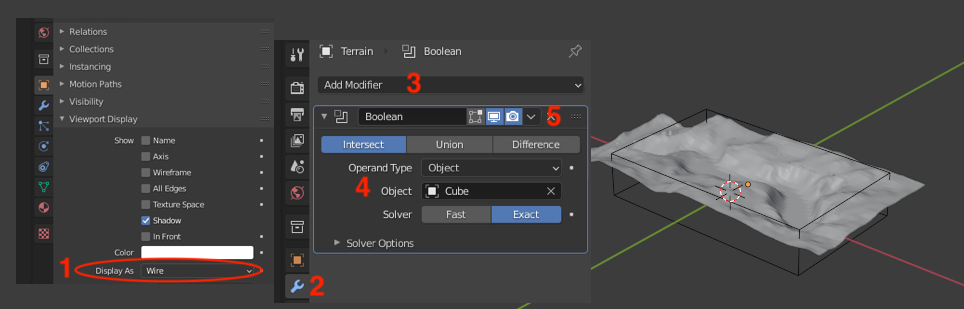
Add a cube to act as the cutout (Add → Mesh → Cube) and then scale and move it to fit the exact area you want to print. To make it easier to move around, adjust the “Viewport Display”[1] to only show the wireframe of the Cube. When the position and the size of the cube fits, click on the wrench[2] of the Terrain, “Add Boolean modifier”[3]. Use the intersect tool and as object, use the Cube[4]. This should present you a cutout of the terrain with a solid bottom. If everything is fine, hit Apply[5]. Now we have already a terrain model which would be printable.</p>

<h2 id="create-track">Create track</h2>
<p><img src="/assets/img/Posts/Blender/40Track.png" alt="image" />
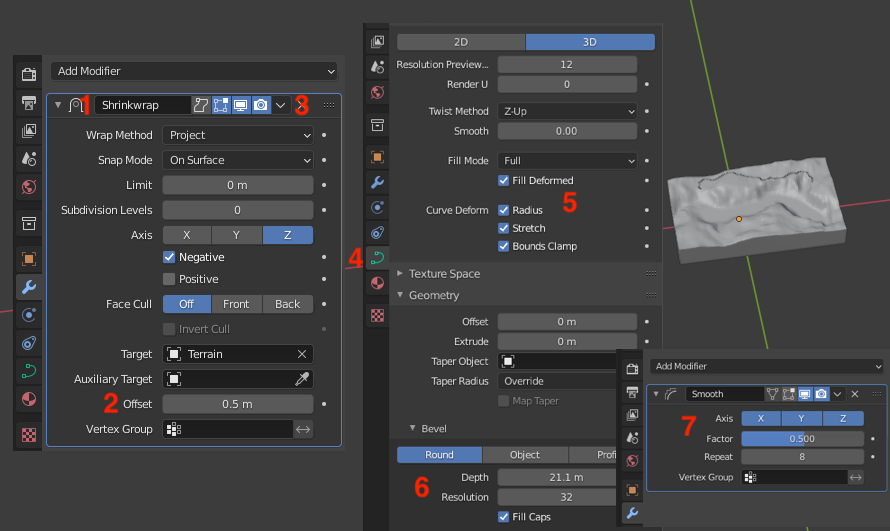
To create the track, choose the track curve and in the Wrench menu it automatically has the shrinkwrapmodifier activated[1]. This will put the track onto the surface of the terrain. As a standard it has a distance of 0.5 m which we will set to 0[2] then hit apply[3]. The next step is making it solid.
In the “Object Data Properties”[4] we have to set a couple of things.</p>
<ul>
  <li>Shape[5]: Fillmode “Full” with “Fill Deformed” and everything checked at “Curve Deform”</li>
  <li>Geometry: To make it really solid
    <ul>
      <li>Extrude makes the Track higher in the Z direction.</li>
      <li>Bevel[6] choose Round
        <ul>
          <li>Depth defines the size of the track. Increase until large enough</li>
          <li>Resolution: 32 (looks the best in my opinion)</li>
          <li>Make sure the “fill Caps” is ticked. Otherwise, it will be hard to get a nice solid track later!</li>
        </ul>
      </li>
    </ul>
  </li>
</ul>

<p>If your track is looking good, you need to convert the track into a mesh. To do this, go to Object → Convert → Mesh.
To reduce hard corners and make the track more round, I Go into the Wrench menu and add a “Smooth” Modifier[7]. Mostly, something like “Repeat: 8” looked nice.</p>

<h2 id="meshmixing">Meshmixing</h2>
<p><img src="/assets/img/Posts/Blender/50Meshmixer.png" alt="image" />
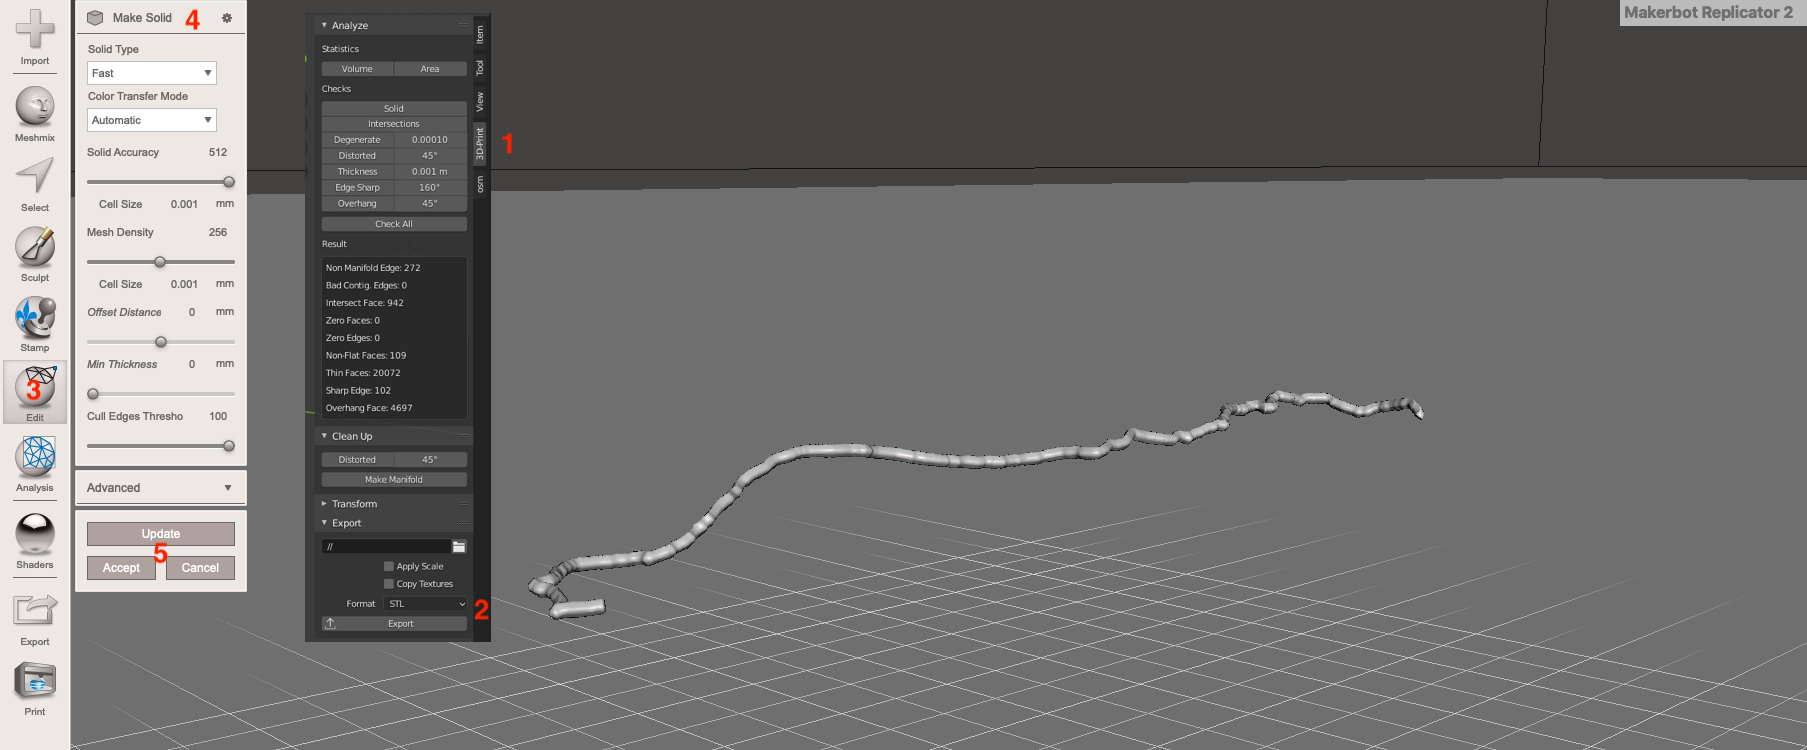
In the 3D print Menu[1] we can now export it as STL[2] to make really solid in Meshmixer.
Load your exported track.stl into Meshmixer. It should already look quite okay, but to be sure we will use the Make Solid Tool in the edit Menu[3]. I Basically turned “Solid Accuracy” and “Cull Edges Threshold” to max and “Mesh density” to sth. in the middle. Hit Update, accept[5] and then export the new solid STL.</p>

<h2 id="cuting-track-into-terrain-surface">Cuting track into terrain surface</h2>
<p><img src="/assets/img/Posts/Blender/60Trackcutting.png" alt="image" />
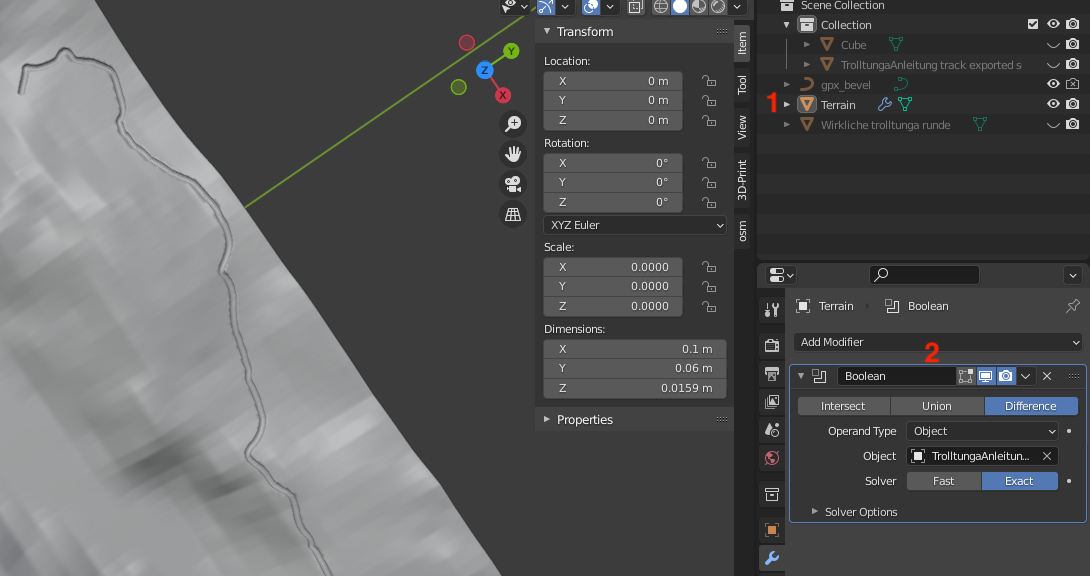
Back in Blender, reimport the solidified Meshmixer STL. It should be in the exact same place as before.
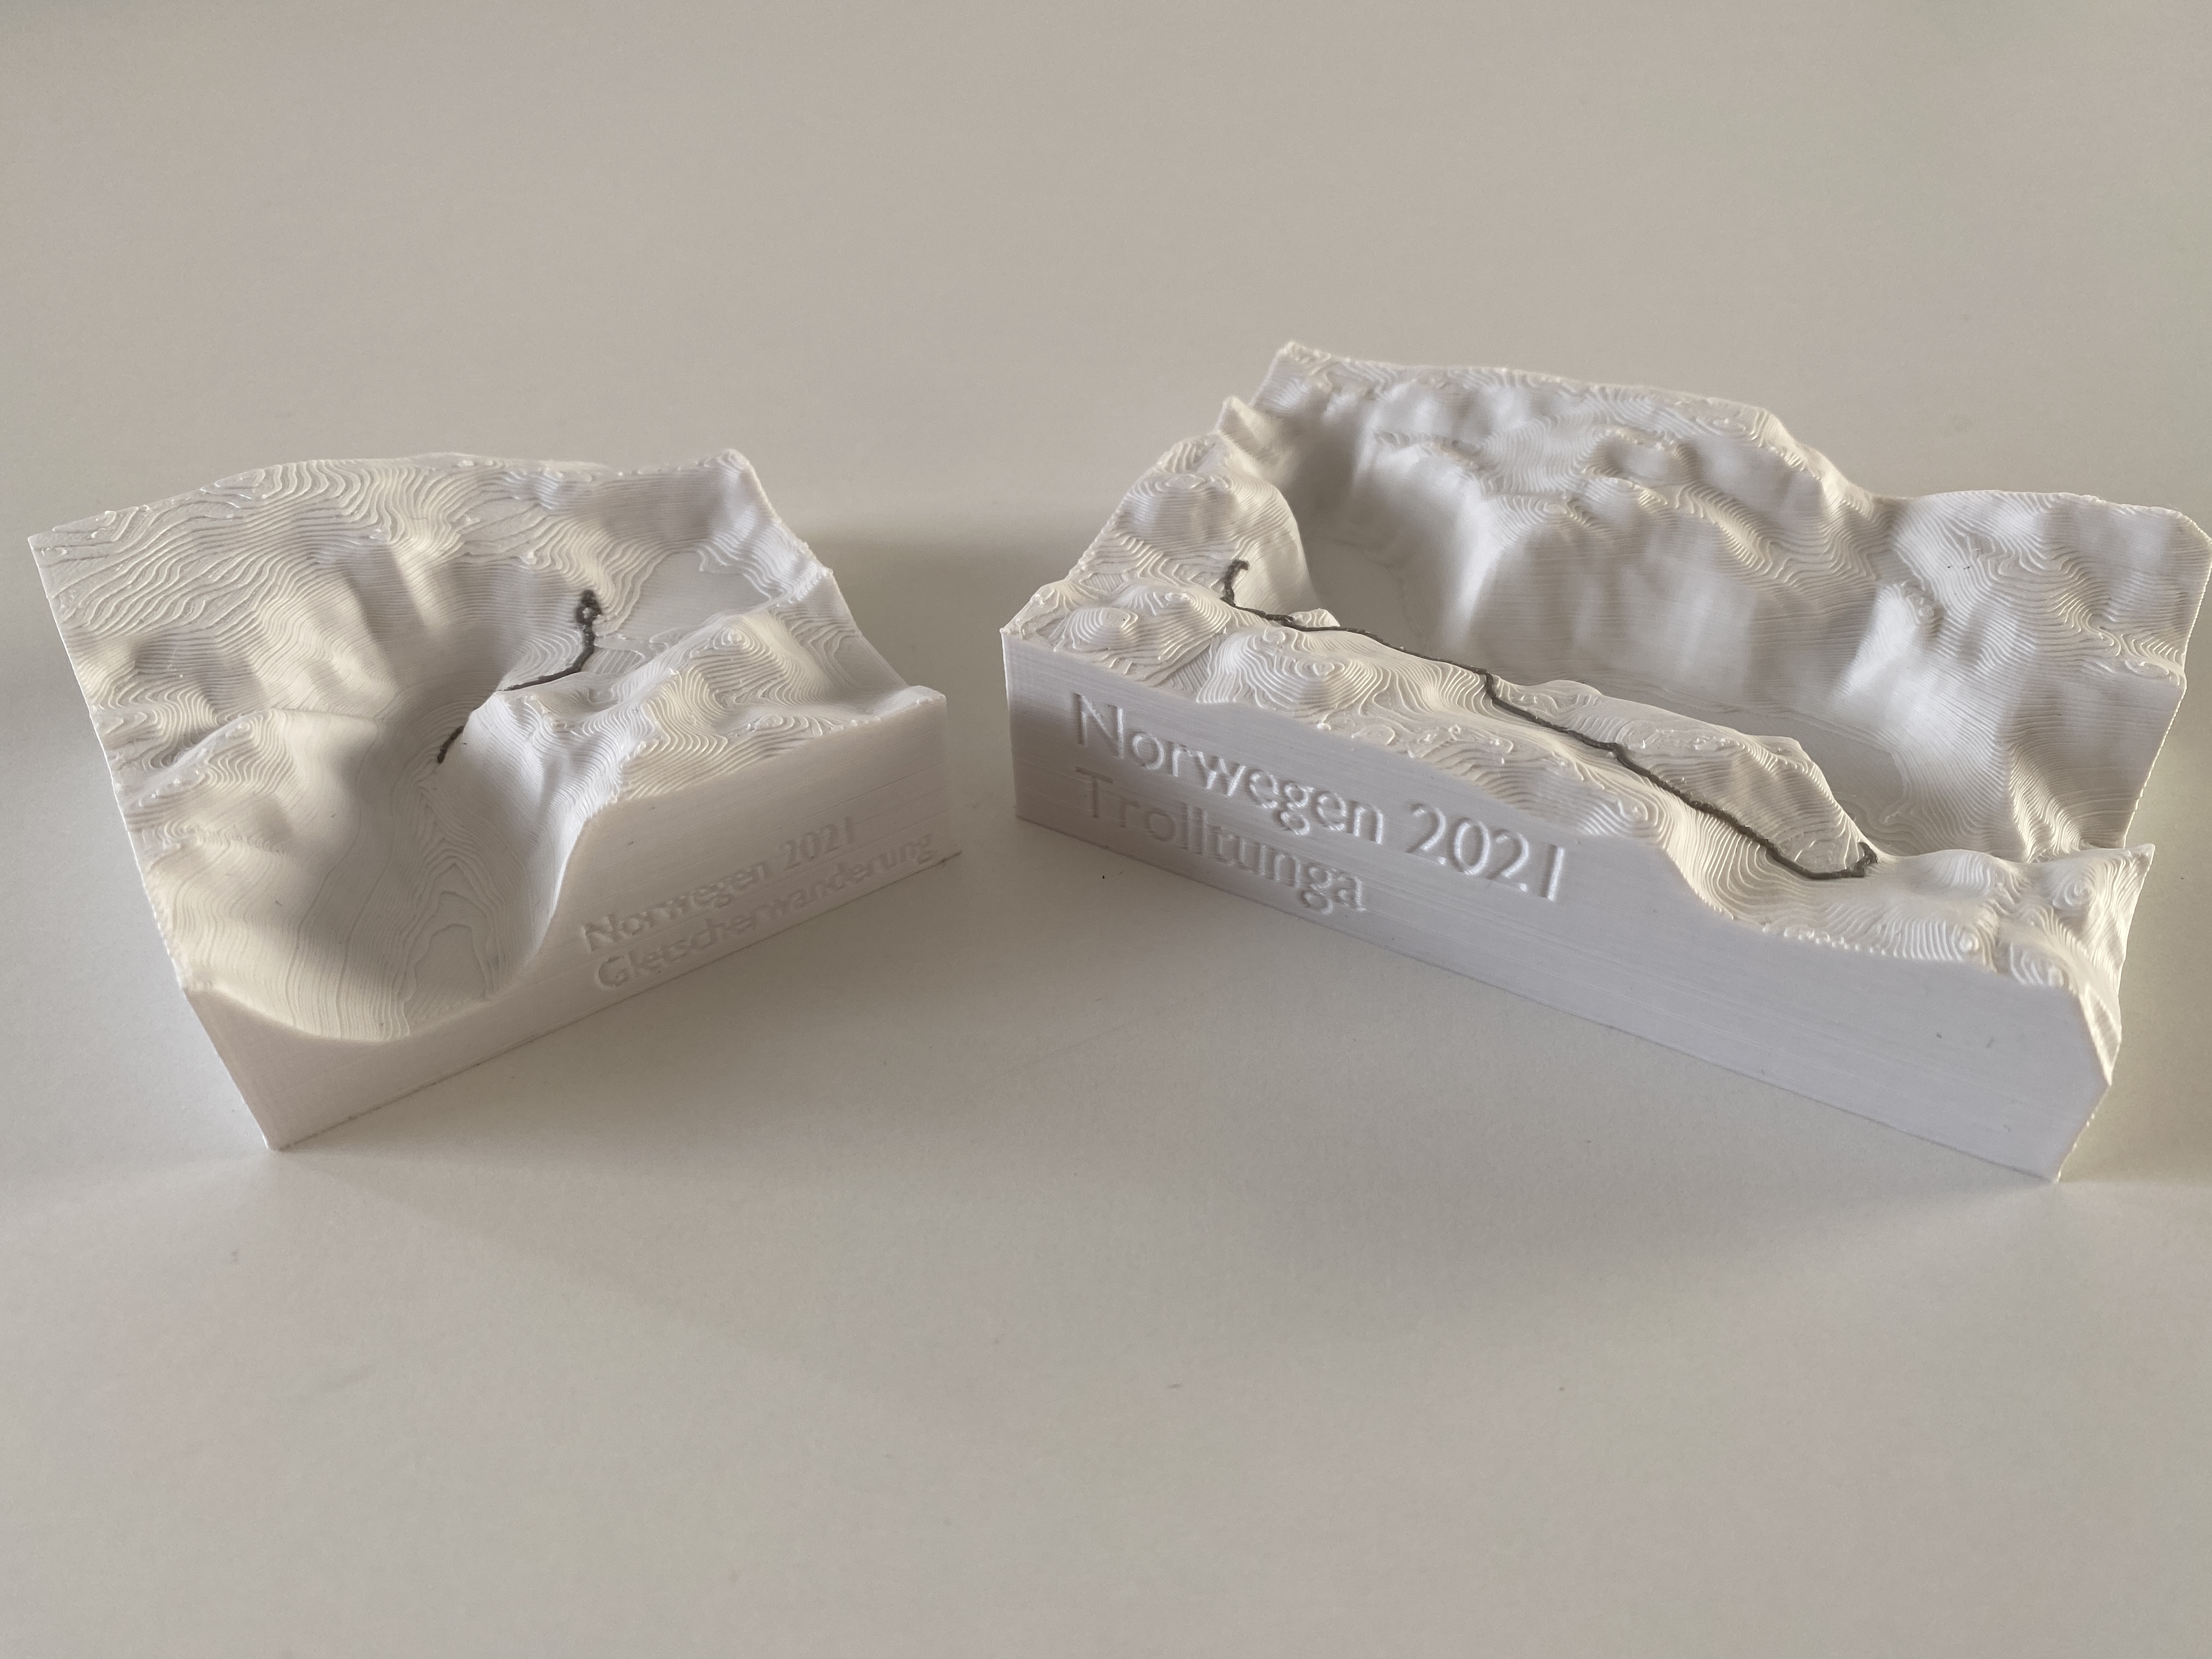
Now choose the terrain model[1] and add a Boolean modifier[2]. Choose difference and then as Object your reimported Solid track. If you Hide the Solid STL in the view, you should see a nice carve in the surface of the terrain model. If everything looks good, hit apply. You could now export the Terrain as STL, and it would be ready to print.</p>

<h2 id="add-some-text">Add some text</h2>
<p><img src="/assets/img/Posts/Blender/70TEXT.png" alt="image" />
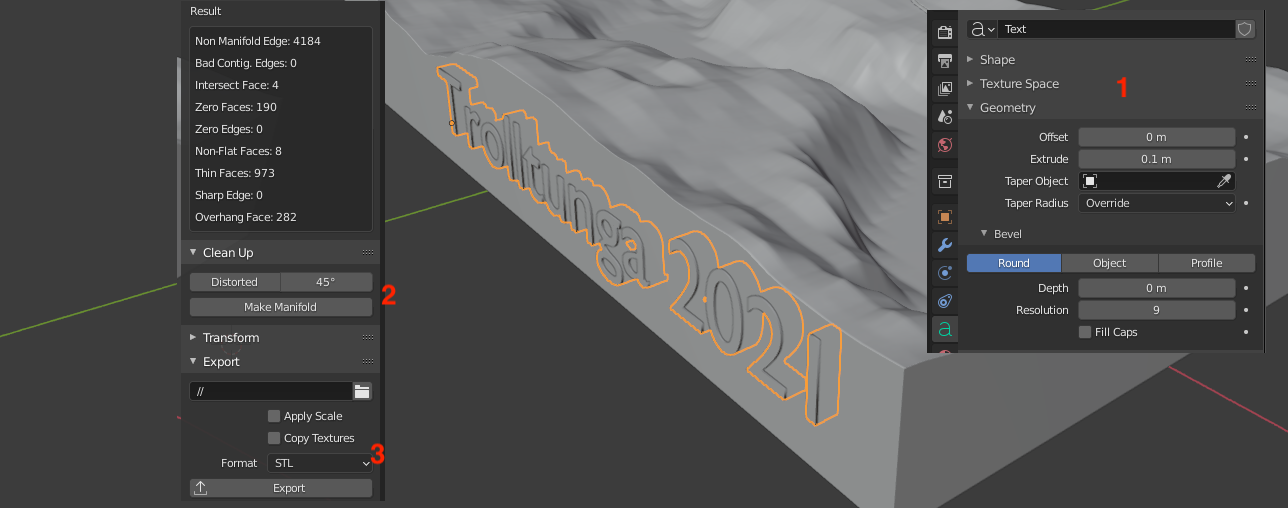
To make it easier to remember the Hike, I added some informational text on the side. To do this, Add → Text. Press Tab to edit the Text, and Tab again to finish editing the text. To make it solid is similar to the track. Go to “Object Data Properties” and in the “geometry” part define the thickness with the Extrude Value[1]. Use the “Item” menu to scale it down and move it to the right position. Make sure it penetrates the model just a bit.
Now you have two options. You can either just print it as an “imprint” on the outer body, or you could also export the letters as STL to print it in color.
Imprint:
Convert your text to mesh. Scale it to just make a slight dent into the outer surface. Choose the terrain and add a boolean modifier Difference with the object text. Then hit apply. You can now export the Terrain as STL and print it together with the colored track
Colored Text:
Convert your text to mesh. Scale it to be a bit thicker inside and being almost flush with the outer surface. Choose the terrain and add a boolean modifier Difference with the object text. Then hit apply. Export the Text and the terrain as STL[3]. You might need to make the text manifold[2] before exporting (3D-Print menu → Cleanup → Make Manifold).</p>

<h2 id="final-results">Final Results</h2>

<p>I am Very pleased with the look of the parts. I used my DAS FILAMENT PLA for the print in white and gray. Both models were printed on one plate in about 7 hours. I used the 0.2 mm Speed print setting with 20% Infill and 3 Perimeter lines and Brim just to be sure. I haven’t tested the printed text, but it looks very good in the slicer
<img src="/assets/img/Posts/Blender/80BlickinsTal.JPG" alt="image" />
<img src="/assets/img/Posts/Blender/81Beide.JPG" alt="image" />
<img src="/assets/img/Posts/Blender/82
PrusaWithText.png" alt="image" /></p>
<h2 id="thoughts-and-future-steps">Thoughts and Future steps</h2>
<p>If you have no Multimaterial capabilities, you could maybe also just print it with just the grove and color it in later with a pen or acrylic paint.
With the Blender OSM Plugin it is also possible to get more information like streets, lakes, rivers, buildings, forests and other stuff. It would be nice to see water areas on the print and also Streets or buildings. Maybe sth like my hometown or sth like that as a model would look very nice with all the houses and streets.</p>]]></content><author><name>Sebastian</name></author><summary type="html"><![CDATA[I was on a roadtrip through Norway this summer with a friend, and we did a couple of hikes. About a year ago I tried 3Dprint the GPS tracks with a tutorial from Instructables which was kinda successful but complicated. I never used Blender before, so it was totally new to me. Unfortunately, Blender changed a couple of things in their UI and functions which made it a bit hard to follow. In the following, I will document my steps with the current Blender Version (2.93.5 for Mac) and Meshmixer.]]></summary></entry><entry><title type="html">Kettler Data Interface</title><link href="https://lauster24.de/kettler-data-interface.html" rel="alternate" type="text/html" title="Kettler Data Interface" /><published>2020-11-29T00:00:00-06:00</published><updated>2020-11-29T00:00:00-06:00</updated><id>https://lauster24.de/Kettler-Data-Interface</id><content type="html" xml:base="https://lauster24.de/kettler-data-interface.html"><![CDATA[<p>With the whole pandemic, I decided to do something for my cardiovascular system. So I started to look for an exercise bike.
After a short search on the used market, I found one. A Kettler (Good german quality work) FX1 bike. When I saw that it has an “interface”, I immediately contacted the seller.
With a bit of googling around found out what this “interface actually is. I came upon a <a href="http://technomathematik.blogspot.com/2013/10/ergometer-kettler-fx1-serial-protocol.html">Blogpost</a> from 2013 where somebody documented a bit about it. With the Interface it is possible to get information out of it but also to set various settings like target Power or distance. Kettler uses this with their “Kettler World Tours” Software, which allows you to “drive around the world” simulated.</p>

<p>My Plan was to use this to extract the Data and Store it in my Openhab2 InfluxDB with Grafana to visualize it. Because I love collecting Data :)</p>

<h1 id="so-whats-the-plan">So, what’s the plan?</h1>
<p>Extract the Data and send it via MQTT to my OpenHab which will then put everything into the InfluxDB to view the values in a Grafana Dashboard.</p>

<h1 id="but-how">But How?</h1>
<p>I used a Nodemcu, an MAX3232 RS232 Shield and one of those cheap LM2596 DC-DC Converters.
Everything is nicely Hotglued in the Display mount on the Exercise bike. The DC-DC Converter gets its power from the Kettler Display unit. It is powered with 19V which is then converted down to about 7V which is then fed into the Nodemcu.</p>

<p>From the Blogpost I knew that I only need to spam “ST\r\n” and the bike will answer with all the metrics it currently has.</p>
<blockquote>
  <p>It does not need any arguments and its output consists of 8 fields separated by tab-characters, where each fields means [pulse in Hz][rpm][speed in 0.1 km/h ][distance in 0.1 km][requested power][energy in kJ][time in minutes:seconds][actual power (?)]</p>
  <blockquote>
    <p>st -&gt; 000\t000\t000\t000\t025\t0000\t00:00\t000</p>
  </blockquote>
</blockquote>

<h1 id="the-code">The Code</h1>
<p>In the beginning, I used an Arduino Mega to use Serial1 with the Kettler and Serial0 to report everything to my laptop for debugging and testing. When everything was fine, I switched to the Nodemcu and added the rest.</p>

<p>The Code is Based around the <a href="https://github.com/knolleary/pubsubclient">PubSubClient Arduino Library</a> example sketches by Nick O’Leary.</p>

<div class="language-plaintext highlighter-rouge"><div class="highlight"><pre class="highlight"><code>#include &lt;ESP8266WiFi.h&gt;
#include &lt;PubSubClient.h&gt;

#define wifi_ssid "*****"
#define wifi_password "*********"
#define mqtt_server "MQTT_SERVER_IP"
#define mqtt_user "USERNAME"
#define mqtt_password "PASSWORD"
#define Datentopic "sensor/Fahrrad"

WiFiClient espClient;
PubSubClient client(espClient);
char Inhalt[35] = "";
int n = 0;
int eins = 0;
int zwei = 0;
int drei = 0;
int vier = 0;
int Puls = 0;
int Drehzahl = 0;
int Geschwindigkeit = 0;
int Distanz = 0;
int Sollpower = 0;
int kilojoule = 0;
int IstPower = 0;
bool newData = false;
bool first = true;

void setup() {
  Serial.begin(9600);
  setup_wifi();
  client.setServer(mqtt_server, 1883);
  delay(3000);
  first = true;
  //Array initialisieren
  for (int n = 0; n &lt;= 35; n++) {
    Inhalt[n] = '0';
  }
  //beim ersten mal kommt rubbish raus
  Serial.write("ST\r\n");   // read it and send it out Serial1 (pins 0 &amp; 1)
  //wenn serial da ist, erstmal leeren
  while (Serial.available()) {     // If anything comes in Serial1 (pins 0 &amp; 1)
    char muell = Serial.read();
  }
}

void setup_wifi() {
  delay(10);
  WiFi.begin(wifi_ssid, wifi_password);
  while (WiFi.status() != WL_CONNECTED) {
    delay(500);
  }
}

void reconnect() {
  // Loop until we're reconnected
  while (!client.connected()) {
    // Attempt to connect
    // If you do not want to use a username and password, change next line to
    // if (client.connect("ESP8266Client")) {
    if (client.connect("ESP8266Client", mqtt_user, mqtt_password)) {
    } else {
      delay(5000);
    }
  }
}
void Kettler() {
  Serial.write("ST\r\n");   // read it and send it out Serial1 (pins 0 &amp; 1)
  n = 0;
  while (Serial.available()) {     // If anything comes in Serial1 (pins 0 &amp; 1)
    Inhalt[n] = Serial.read();
    //Serial.write(Inhalt[n]);   // read it and send it out Serial (USB)
    n++;
    newData = true;
  }
  if (newData == true) {
    //Puls
    eins = Inhalt[0] - '0';
    zwei = Inhalt[1] - '0';
    drei = Inhalt[2] - '0';
    Puls = 100 * eins + 10 * zwei + drei;

    //rpm
    eins = Inhalt[4] - '0';
    zwei = Inhalt[5] - '0';
    drei = Inhalt[6] - '0';
    Drehzahl = 100 * eins + 10 * zwei + drei;

    //Geschwindigkeit
    eins = Inhalt[8] - '0';
    zwei = Inhalt[9] - '0';
    drei = Inhalt[10] - '0';
    Geschwindigkeit = 10 * eins + 1 * zwei + drei * 0.1;

    //Distanz
    eins = Inhalt[12] - '0';
    zwei = Inhalt[13] - '0';
    drei = Inhalt[14] - '0';
    Distanz = 10 * eins + 1 * zwei + drei * 0.1;

    //Sollpower
    eins = Inhalt[16] - '0';
    zwei = Inhalt[17] - '0';
    drei = Inhalt[18] - '0';
    Sollpower = 100 * eins + 10 * zwei + drei;

    //Kilojoule
    eins = Inhalt[20] - '0';
    zwei = Inhalt[21] - '0';
    drei = Inhalt[22] - '0';
    vier = Inhalt[23] - '0';
    kilojoule = 1000 * eins + 100 * zwei + 10 * drei + vier;

    //IstPower
    eins = Inhalt[31] - '0';
    zwei = Inhalt[32] - '0';
    drei = Inhalt[33] - '0';
    IstPower = 100 * eins + 10 * zwei + drei;

    newData = false;
  }
}
void loop() {
  if (!client.connected()) {
    reconnect();
  }
  client.loop();
  Kettler();
  if (first == false) {
    client.publish("sensor/Fahrrad/Puls", String(Puls).c_str(), true);
    client.publish("sensor/Fahrrad/Drehzahl", String(Drehzahl).c_str(), true);
    client.publish("sensor/Fahrrad/Geschwindigkeit", String(Geschwindigkeit).c_str(), true);
    client.publish("sensor/Fahrrad/Distanz", String(Distanz).c_str(), true);
    client.publish("sensor/Fahrrad/Sollpower", String(Sollpower).c_str(), true);
    client.publish("sensor/Fahrrad/kilojoule", String(kilojoule).c_str(), true);
    client.publish("sensor/Fahrrad/IstPower", String(IstPower).c_str(), true);
  }
  first = false;
  delay(10000);
</code></pre></div></div>
<p>(Yes I know. The Number-conversion is bad)</p>

<p>When I finally got all my values in Openhab, I went for a ride to test everything.</p>

<p>The Kettler has a Dongle for wireless Heartrate communication to a Cheststrap. While my stuff was not powered, everything worked fine, but as soon as everything was powered, the HR Communication didn’t work anymore. After a bit of googling, I found out that these dongles work with a 5kHz transmission frequency. Just under the connector I mounted the LM2596 which operates with an 150kHz Frequency. This was probably distorting the signal for the receiver. After moving the DC-DC Converter to the top of the enclosure, everything was fine.</p>

<h1 id="the-result">The Result</h1>
<p><img src="/assets/img/Posts/Kettler/Grafana.png" alt="image" />
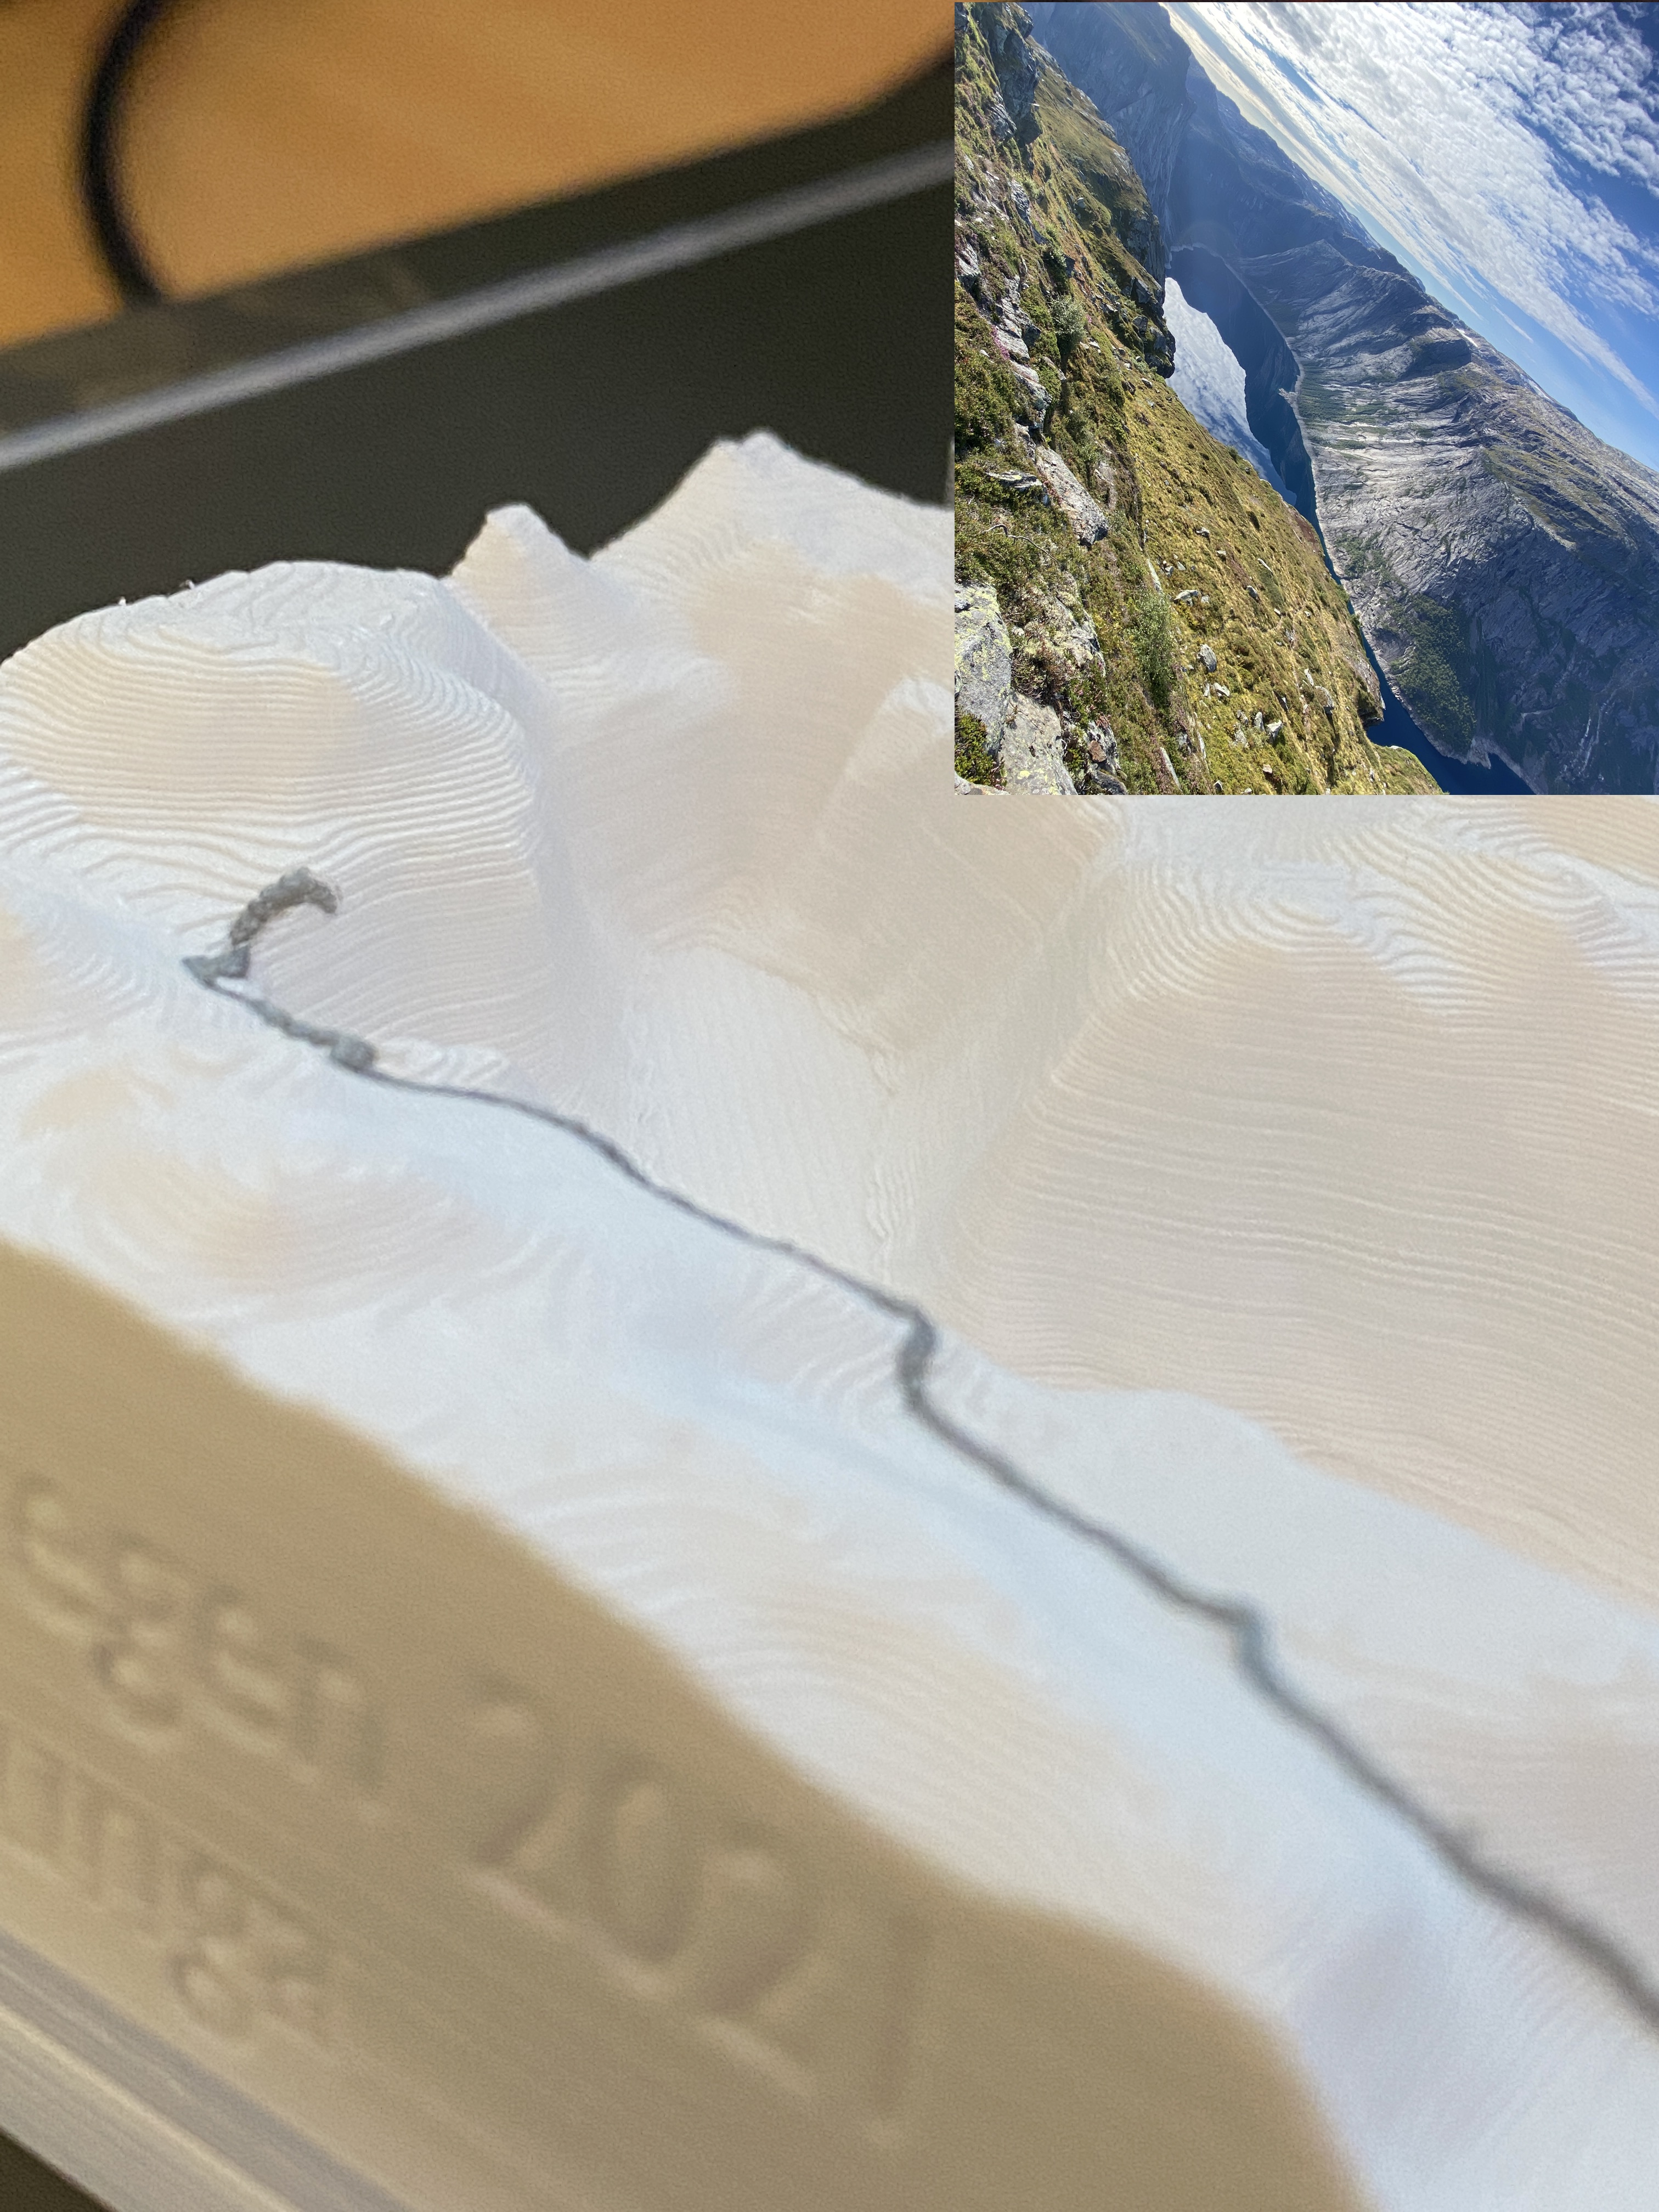
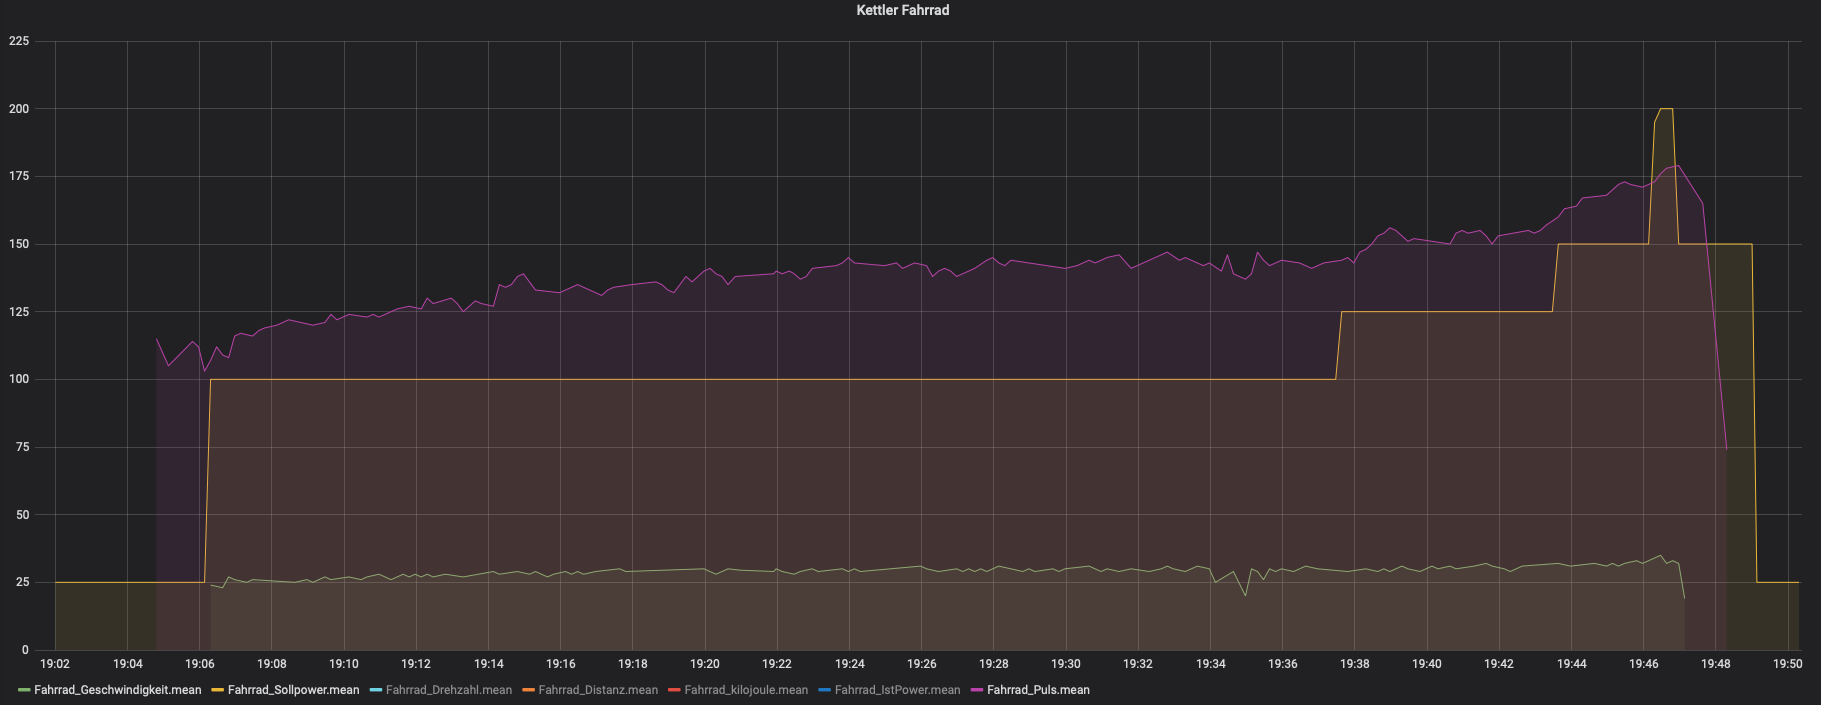
Violet: HR, Yellow: Targetpower, Green: Speed</p>

<h1 id="things-i-would-do-better">Things I would do better</h1>
<p>In the process I accidentally switched VIN and GND which fried the USB Chip on the Nodemcu. After desoldering the chip, it was working again, but I am not able to easily do code changes. So in the future, I will use something like <a href="https://github.com/jandrassy/ArduinoOTA">ArduinoOTA</a> to make the ESP programmable via Wi-Fi. Makes changes easier :)</p>

<p>Also, the conversion of the Values from Serial could be handled better.</p>]]></content><author><name>Sebastian</name></author><summary type="html"><![CDATA[With the whole pandemic, I decided to do something for my cardiovascular system. So I started to look for an exercise bike. After a short search on the used market, I found one. A Kettler (Good german quality work) FX1 bike. When I saw that it has an “interface”, I immediately contacted the seller. With a bit of googling around found out what this “interface actually is. I came upon a Blogpost from 2013 where somebody documented a bit about it. With the Interface it is possible to get information out of it but also to set various settings like target Power or distance. Kettler uses this with their “Kettler World Tours” Software, which allows you to “drive around the world” simulated.]]></summary></entry></feed>